Golang Performance Penalty in Kubernetes
Motivation
Recently I had to deploy a Golang application in Kubernetes, it was a very lightweight sidecar and I was surprised to see that it was performing a little bit slower than I anticipated. I am not going to talk in detail about this application and the nature of the traffic, but I was able to fix this performance issue by setting the environment variable GOMAXPROCS to match the Kubernetes deployment resource limit.
So, I am writing this blog post to explore the impact of GOMAXPROCS in Kubernetes and why this is a blindspot where quite a lot of performance goes to waste. We will be doing some benchmarks in a controlled environment to see if it really is that big of a deal.
TL;DR
In Kubernetes, GOMAXPROCS defaults to the number of CPU cores on the Node, not the Pod. If your Pod has a much lower CPU limit (e.g., 1 core on a 32-core node), your Go app will still try to run with GOMAXPROCS=32. This mismatch can hurt performance due to unnecessary context switching and CPU contention.
Fix: Explicitly set GOMAXPROCS to match the Pod’s CPU limit.
There is an issue opened to make go runtime aware of CPU limits
Update
This has been fixed since Go 1.25 :) Let's Go Go Team!

The Basics
Before we jump into the benchmarks, it is important to understand how Go handles CPU concurrency and the effect of GOMAXPROCS in Kubernetes
OS Threads and Go
Go uses goroutines – lightweight, user threads. But, they don't run by themselves. They are scheduled onto the Operating System threads, which are managed by the Kernel and executed on actual CPU cores.
So, while we can spin up thousands of goroutines, they ultimately need to run on actual CPU cores (and threads), which are a lot less in number
What is GOMAXPROCS
According to the official documentation
The GOMAXPROCS variable limits the number of operating system threads that can execute user-level Go code simultaneously.GOMAXPROCS is set to the number of available CPU cores -- as seen by the Go runtimeWhat is Context Switching
Let's consider the scenario
- We have two applications running in Kubernetes on a single node
- Each app has 10 threads
- Only one physical core on the node
What we know
- CPU can run only 1 thread at a time (Ignore SMT to keep things simpler)
- But we have 20 total threads (10 from each app)
- So the CPU must take turns running each thread
How the kernel makes it work
- The Linux Kernel uses a scheduler to decide which thread to run next
- It gives each thread a small time slice (few milliseconds)
- After that time is up, the CPU switches to the next thread
- This is called a context switch
- The kernel will keep doing this over and over, making it look like threads are running at the same time
- Now of course, if we have more cores, we can run more processes concurrently
Kubernetes CPU limits
I strongly recommend my other post where I dive deep into Kubernetes internals, if you are interested!
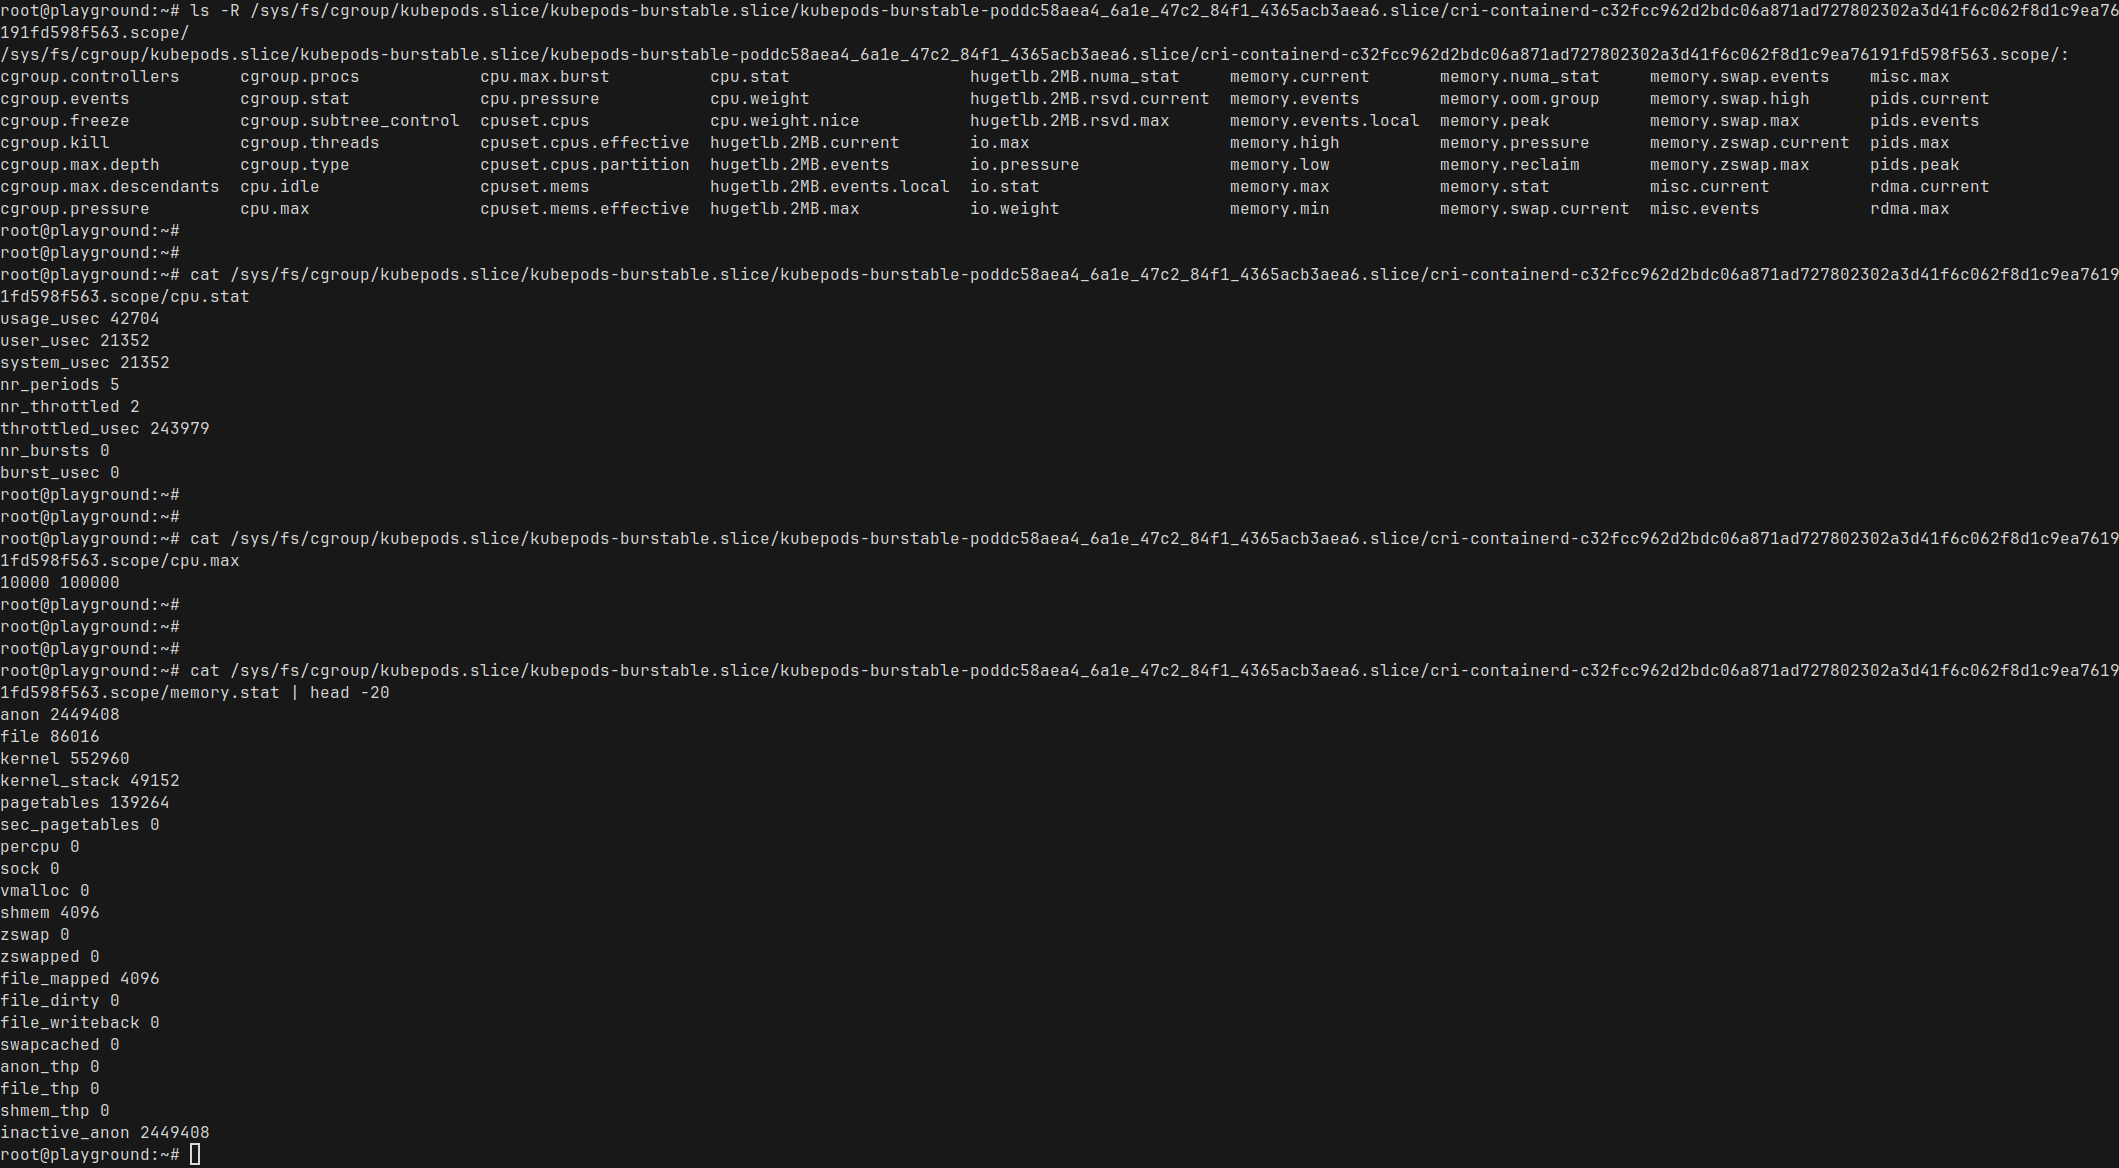
As you are probably aware of, Kubernetes lets us set resource requests and limits – for memory and CPU. In the context of CPU:
- Request: the amount of CPU the container is guaranteed
- Limit: the maximum amount of CPU the container is allowed to use
If we set a limit of 1, Kubernetes will throttle the container to 1 vCPUs worth of compute time even if the node has 32 available.
This is done using Linux cgroups (control groups), which allow the Kernel to constrain how much CPU time a process can use over time.
Now, the problem
Hope you have read the crash course on the OS basics ;) You probably have identified the issue already. Let's walk through it step by step
- You have a Kubernetes node with, say, 32vCPU cores
- You have a pod running with CPU limit of 1
- This pod is running a Go app with no extra configuration
- The Go runtime in the pod sees that there are 32 CPU cores
- So it sets the
GOMAXPROCSto 32 - And then, when needed, Go will spawn up to 32 threads even though the app will get to use only 1vCPU worth of time
- This pod is running a Go app with no extra configuration
Now, let's say this Go app is a Web server receiving a high volume of requests. And say the average latency is 20ms
Here, the 32 threads spawned by go are competing for one core's worth of CPU time
Here is what happens:
- Multiple requests arrive at once
- Go spins up
goroutinesand schedules them across its 32 threads - If a pod is limited to 1 CPU, it can still run many threads in parallel across cores — but the total CPU time used across all threads can’t exceed 1 core’s worth over a given time window
Essentially, this leads to
- Increased request queuing
- A lot more context switching (depending on how CPU intensive the application is – You will see this in action soon)
- A lot more CPU throttling
- And finally, the application latency will keep on increasing!
Alright, enough theory, let's do some benchmarks!
Let's do the Benchmark
The Hardware
At first, I thought of running the benchmark in a Cloud Provider's Kubernetes cluster, but I decided against it because I have no control over the physical hardware and I did not want any noisy neighbors affecting the benchmark results. So I decided to keep things simple and run the tests on my own hardware. Maybe one day I will do another test in a Cloud Provider's cluster and compare the results.
For now, the benchmark runs on a machine from my homelab: a Lenovo ThinkCentre M720Q, powered by a 6-core Intel i5-8400T.
As my grandma used to say:
never waste an opportunity to flex a good neofetch screenshot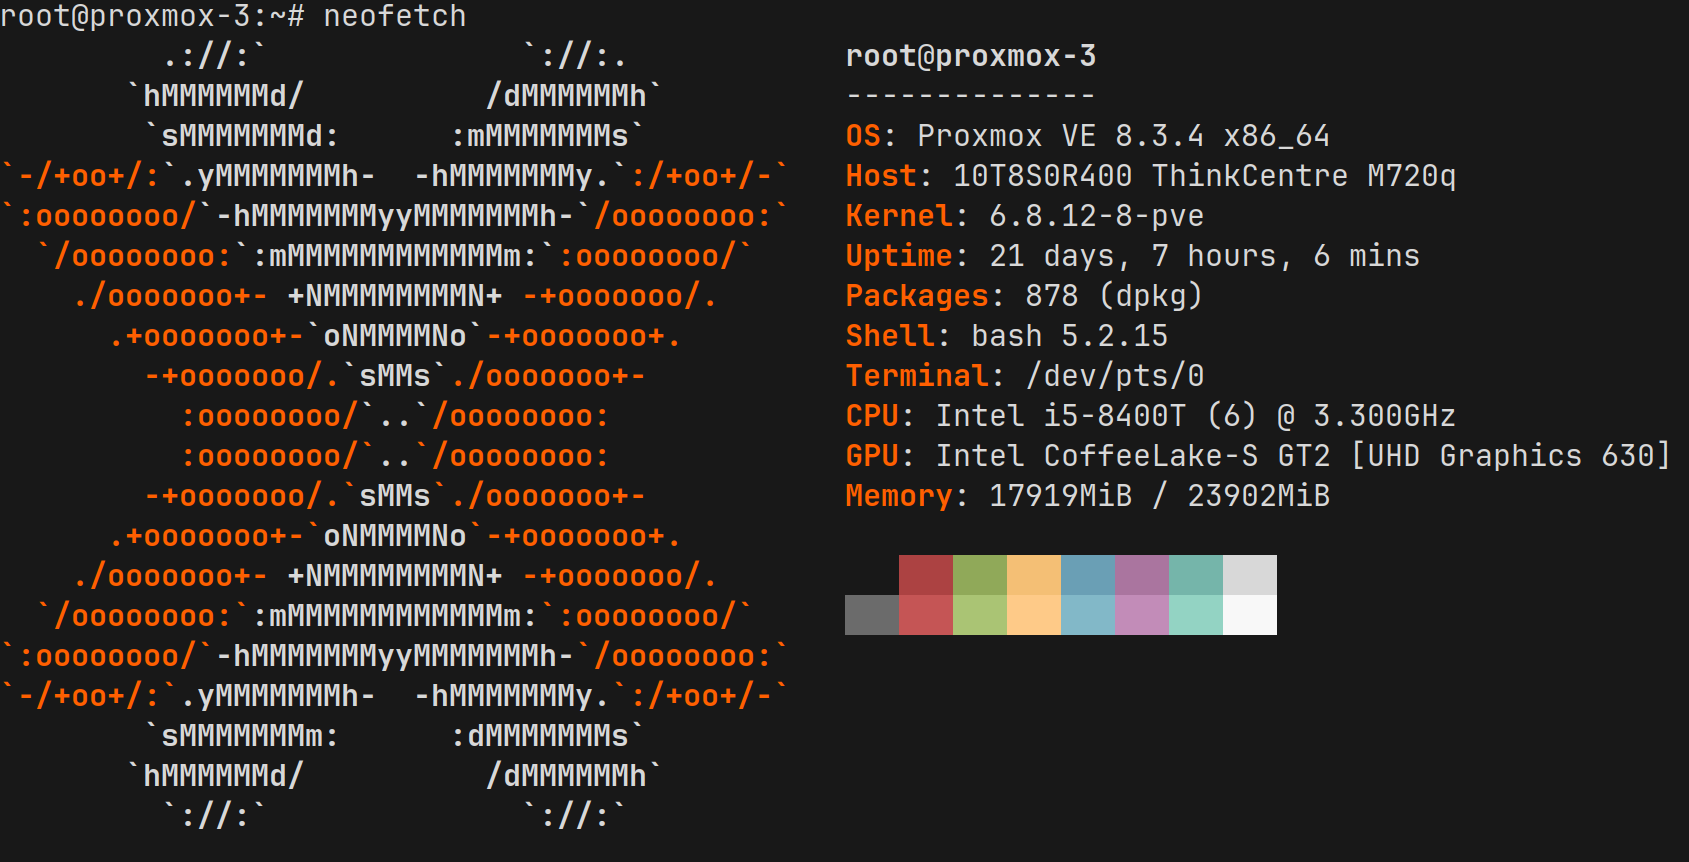
- Runs Proxmox on the host, and running a Debian Virtual Machine as the test machine on Proxmox
- The VM is assigned 6 CPU cores and 8GB of ram
- There are no other workload on this physical machine to skew the results
- We will be running the benchmark tool from another physical machine on the same VLAN
The Software
Code
I wrote (actually, ChatGPT did) a simple Go app for this test. You can find the source HERE. The code has a bunch of handlers, but we are only going to be using the /cpu one here. It takes an argument n which lets us make the request adjust the CPU usage pretty easily, which can be passed as a query string
GOMAXPROCS just need something that is CPU intensive. We are not comparing anything else, just the effect of wrongly configured GOMAXPROCS on cpu intensive applications
Kubernetes
I decided to run a single node k3s "cluster" for Kubernetes.
Monitoring
I am also using Prometheus (scrape time reduced to 5 seconds) with Grafana to show some sweet sweet context switching graphs. I have a blog post here to do that in Docker, if you are interested : https://selfhost.esc.sh/prometheus-grafana/
Benchmark tool
We will use wrk to run benchmarks. It will run from a different physical machine (not my laptop – been burned by thermal throttling before ) on the same VLAN
The tests
The Baseline : Reasonable config - Not CPU bound
We need to get a baseline in terms of performance when it is not CPU bound and with appropriately configured GOMAXPROCS and CPU limits
- CPU Limit : 1
GOMAXPROCS= 1- Number of pods = 6
This should make sense. There are 6 cores assigned to this VM. So, we are running 6 pods and telling each of the pod to run with GOMAXPROCS=1 so the go runtime knows there is only one OS thread for it. Is this the best configuration? Who knows! we will see
Benchmark command
wrk -t8 -c1000 -d180s 'http://192.168.61.100:7000/cpu?n=1'First, let us take a look at the wrk arguments
-t8- This is saying spawn 8 client threads-c1000- Make 1000 concurrent requests from each thread-d180s- Run the test for 3 minutes. (Why 3 minutes? Honestly, because 3-minute graphs looked the coolest in Grafana for these tests)
Let's see what the result looks like
~ ➤ wrk -t8 -c1000 -d180s 'http://192.168.61.100:7000/cpu?n=1'
Running 3m test @ http://192.168.61.100:7000/cpu?n=1
  8 threads and 1000 connections
  Thread Stats   Avg      Stdev     Max   +/- Stdev
    Latency    10.34ms    5.42ms 272.42ms   79.62%
    Req/Sec    12.19k     1.29k   22.29k    70.44%
  17462776 requests in 3.00m, 2.11GB read
Requests/sec:  96961.68
Transfer/sec:     12.02MB
Okay, not bad!
What are we seeing in wrk output
- Latency:
- 10ms avg
- 272ms max – a little spikey, but expected
- Requests/second:
- 12k requests per second per thread
- 96k rps
Let's take a look at Grafana
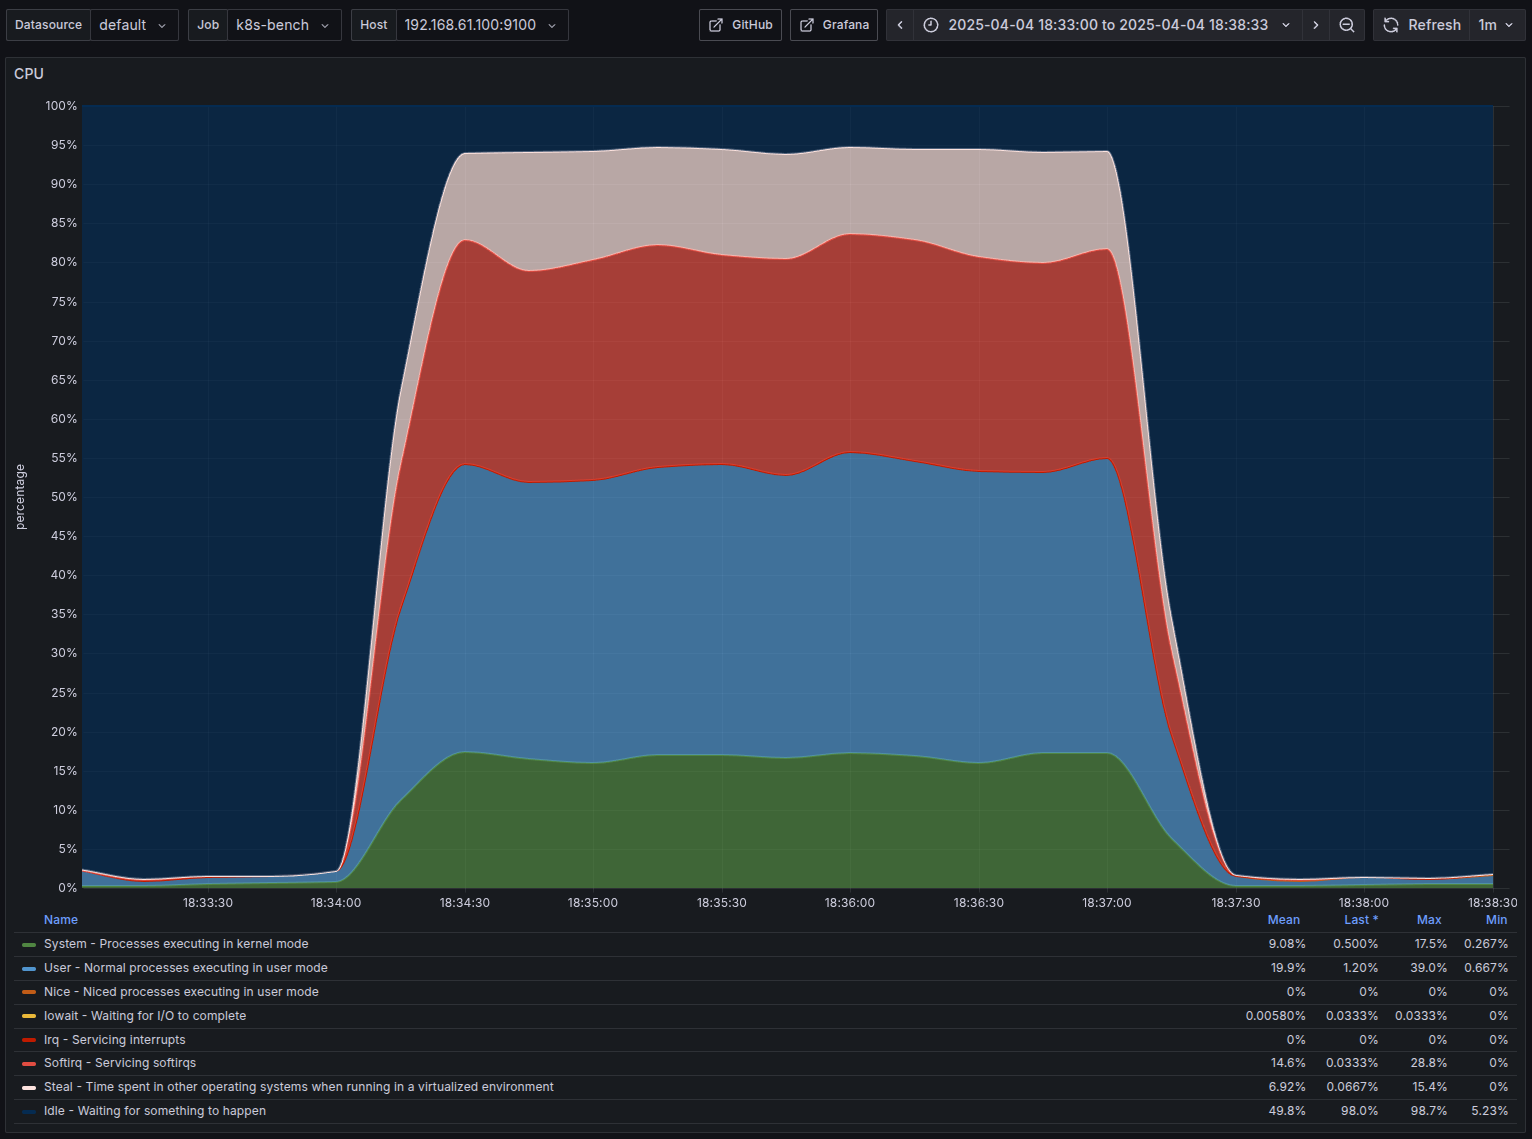
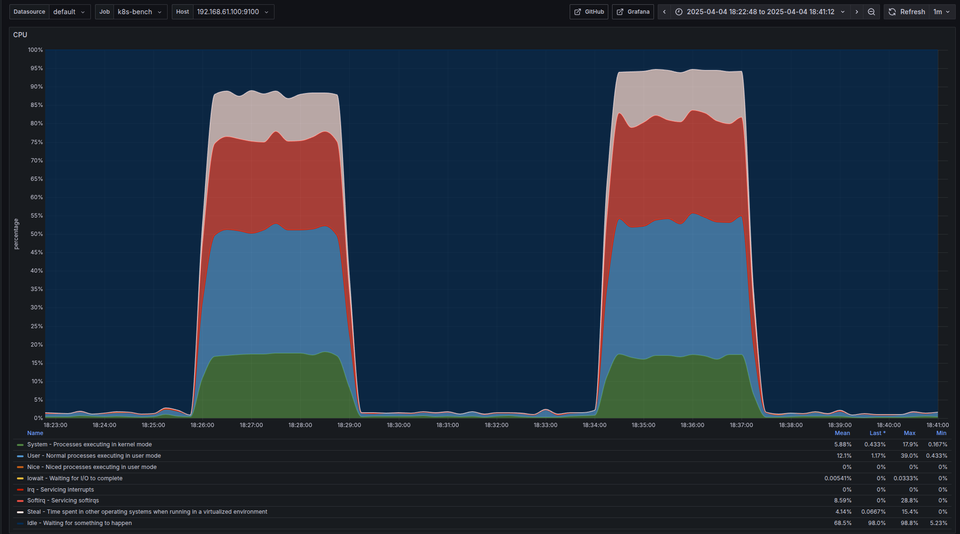
- Nothing out of the ordinary, almost 100% CPU usage
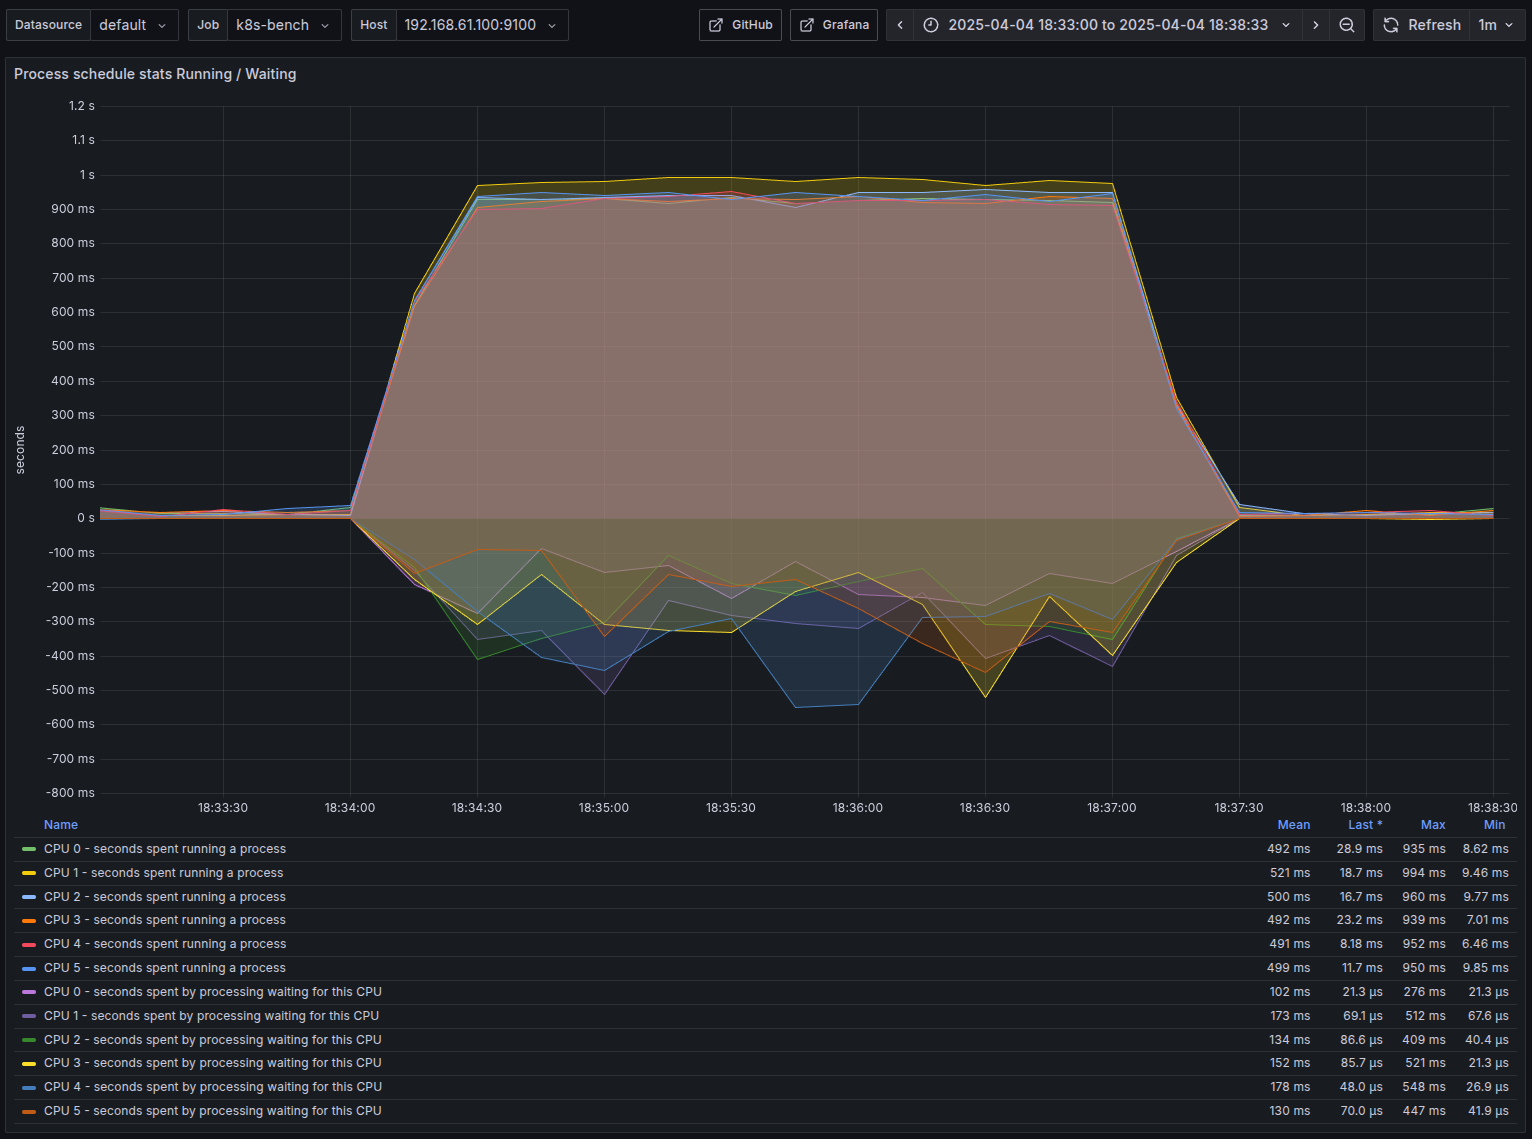
- baseline : Average around 130-15ms time waiting for the CPU
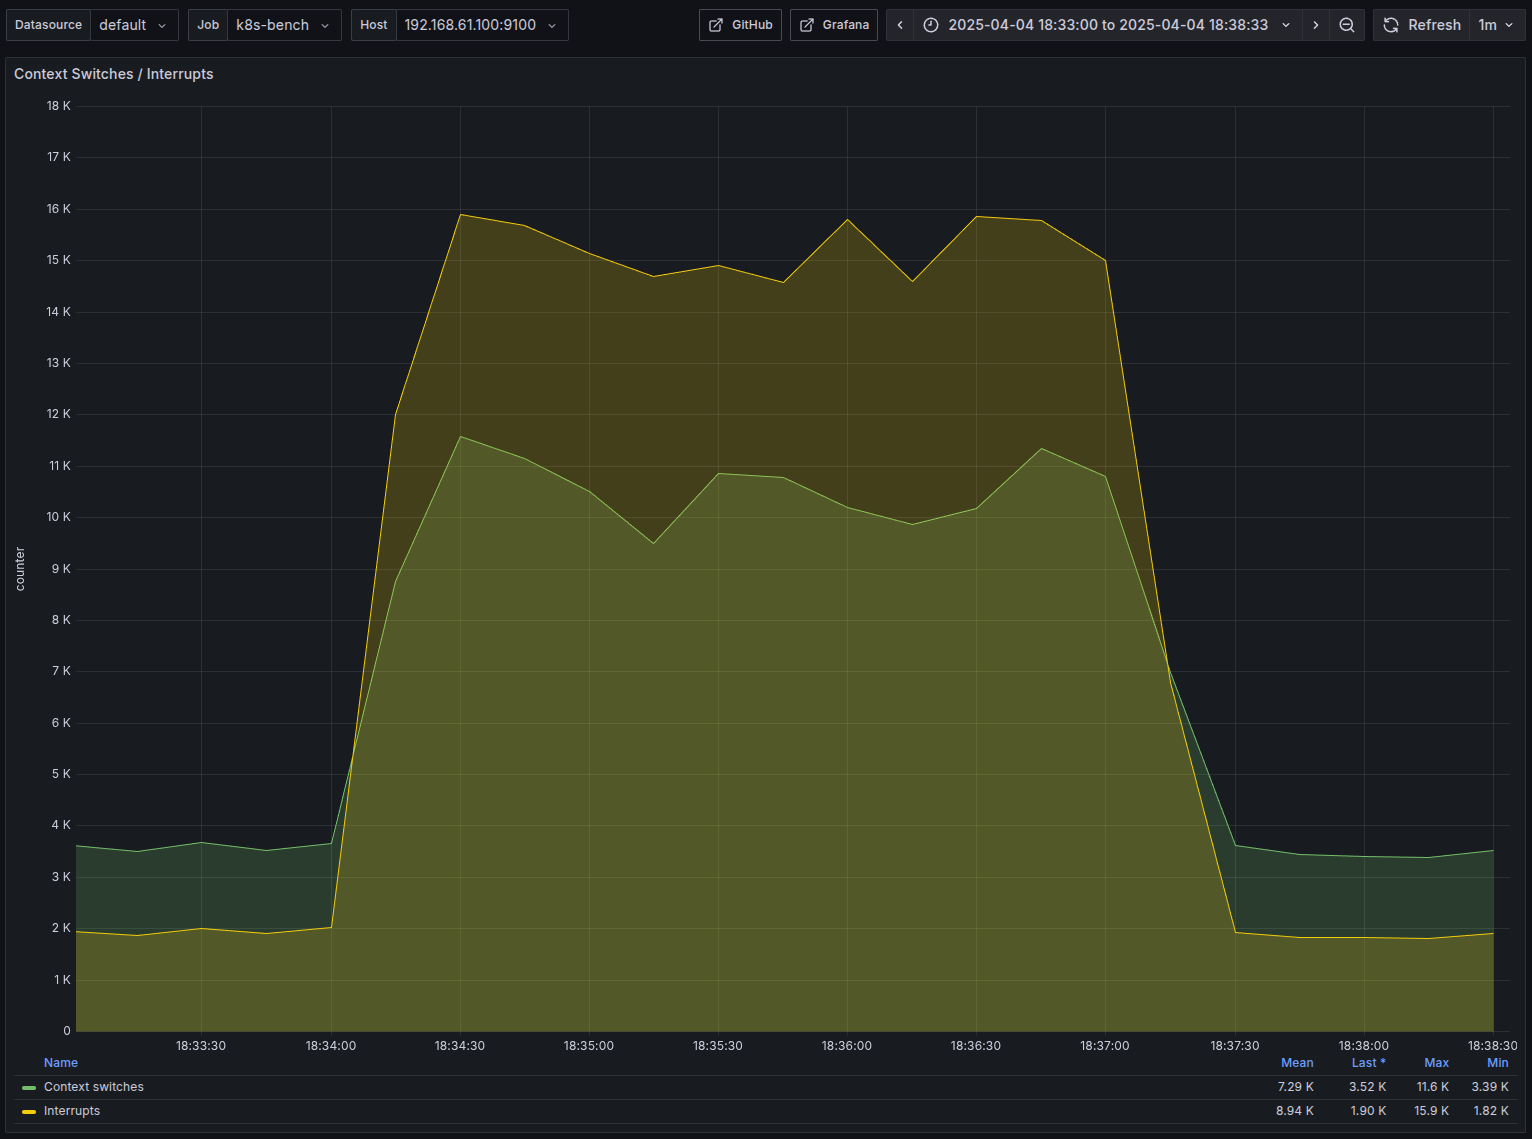
- The Graph that I am most excited about. Around 7k average context switches
Benchmark 1 - GOMAXPROCS = 1
For these tests, we will run 10 pods, to slightly mimick production where there will be often more pods than available CPU.
Benchmark Command
wrk -t8 -c1000 -d180s 'http://192.168.61.100:7000/cpu?n=20'the only difference is the n=20 – This means a lot more CPU bound
wrk output analysis
~ ➤ wrk -t8 -c1000 -d180s 'http://192.168.61.100:7000/cpu?n=20'
Running 3m test @ http://192.168.61.100:7000/cpu?n=20
  8 threads and 1000 connections
  Thread Stats   Avg      Stdev     Max   +/- Stdev
    Latency    20.00ms    8.61ms 255.50ms   70.68%
    Req/Sec     6.31k   543.85    13.54k    71.63%
  9043203 requests in 3.00m, 1.12GB read
Requests/sec:  50213.57
Transfer/sec: 6.37MB- Alright, as we expected, the performance has dropped. Still not too bad
- Latency:
- 20ms avg
- 255ms max
- Requests/second:
- 6k requests per second per thread
- 50k rps
Benchmark 2 - GOMAXPROCS = 32
Same as before, we will run 10 pods. We will use the exact same command as well.
~ ➤ wrk -t8 -c1000 -d180s 'http://192.168.61.100:7000/cpu?n=20'
Running 3m test @ http://192.168.61.100:7000/cpu?n=20
  8 threads and 1000 connections
  Thread Stats   Avg      Stdev     Max   +/- Stdev
    Latency    33.01ms   34.79ms 465.36ms   84.54%
    Req/Sec     5.07k   627.74     9.17k    70.07%
  7268074 requests in 3.00m, 0.90GB read
Requests/sec:  40356.13
Transfer/sec:      5.12MB
I am not going to post the numbers again.
Benchmark Results Comparison
| Metric | GOMAXPROCS=1 | GOMAXPROCS=32 | % change |
|---|---|---|---|
| Avg Latency | 20ms | 33ms | +65% |
| Max Latency | 255ms | 465ms | +82% |
| Overall RPS | 50213 | 40356 | -19.6% |
Grafana Metrics Comparison
I think it is a lot more helpful to see it visualized
G to denote GOMAXPROCS in the graphs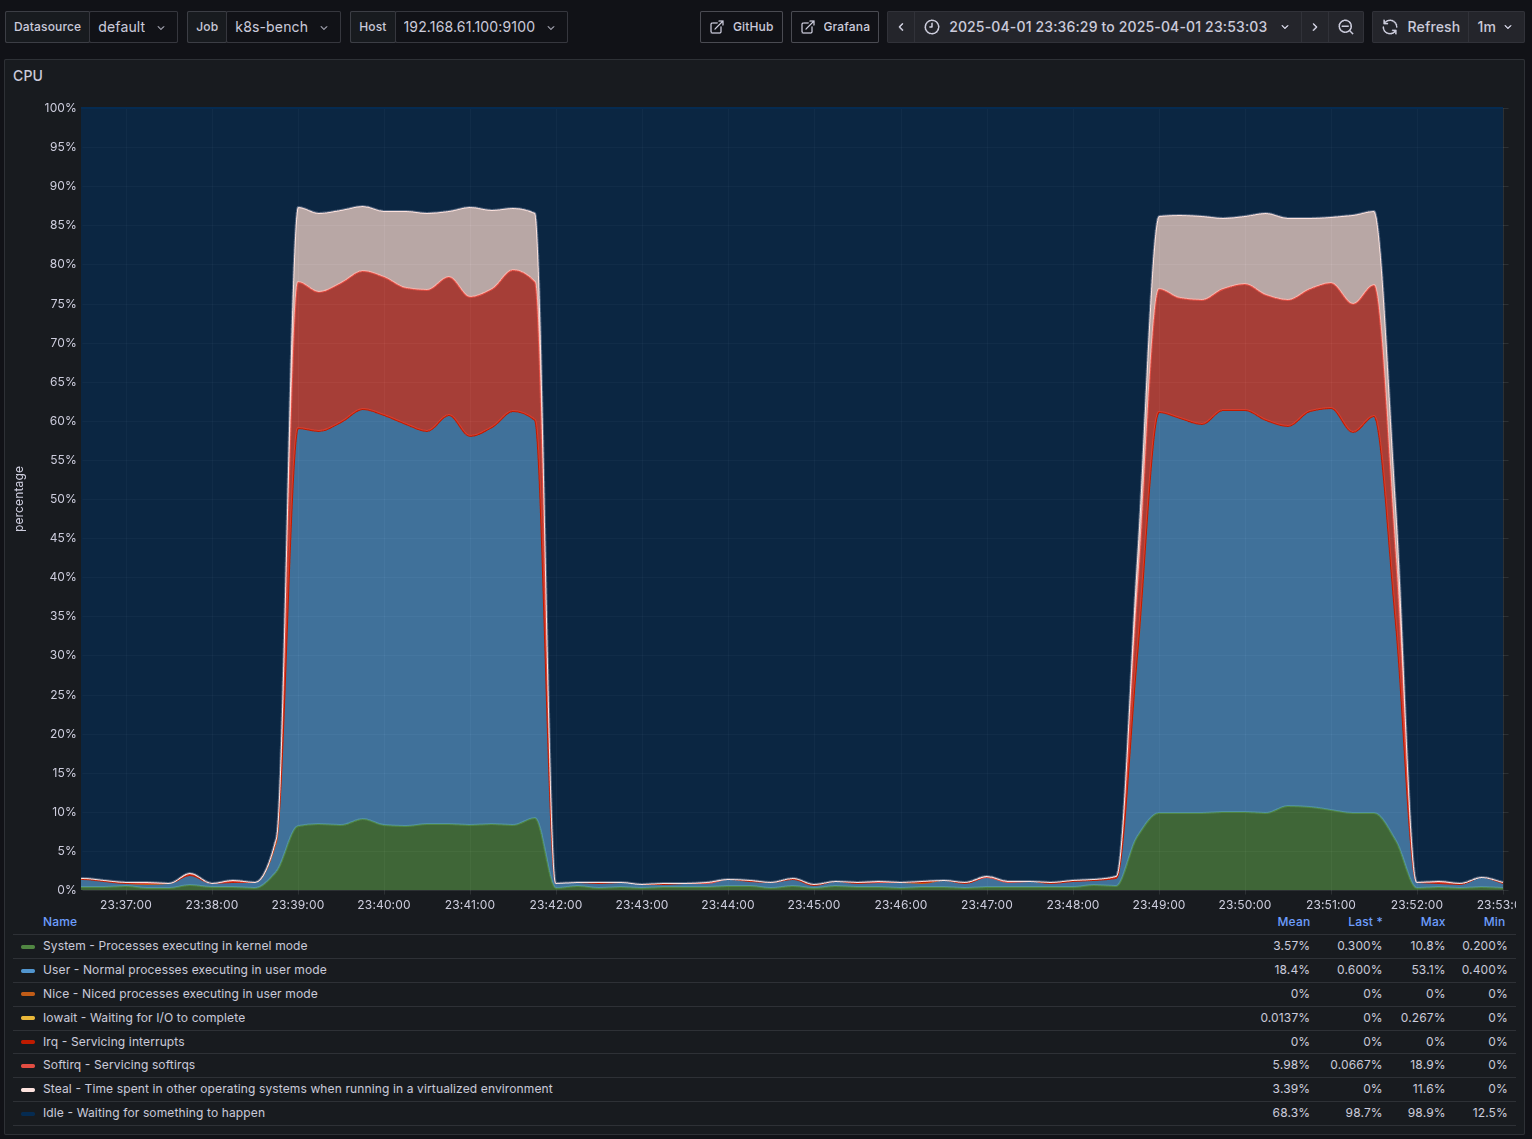
- Nothing Interesting here. Both used almost full CPU
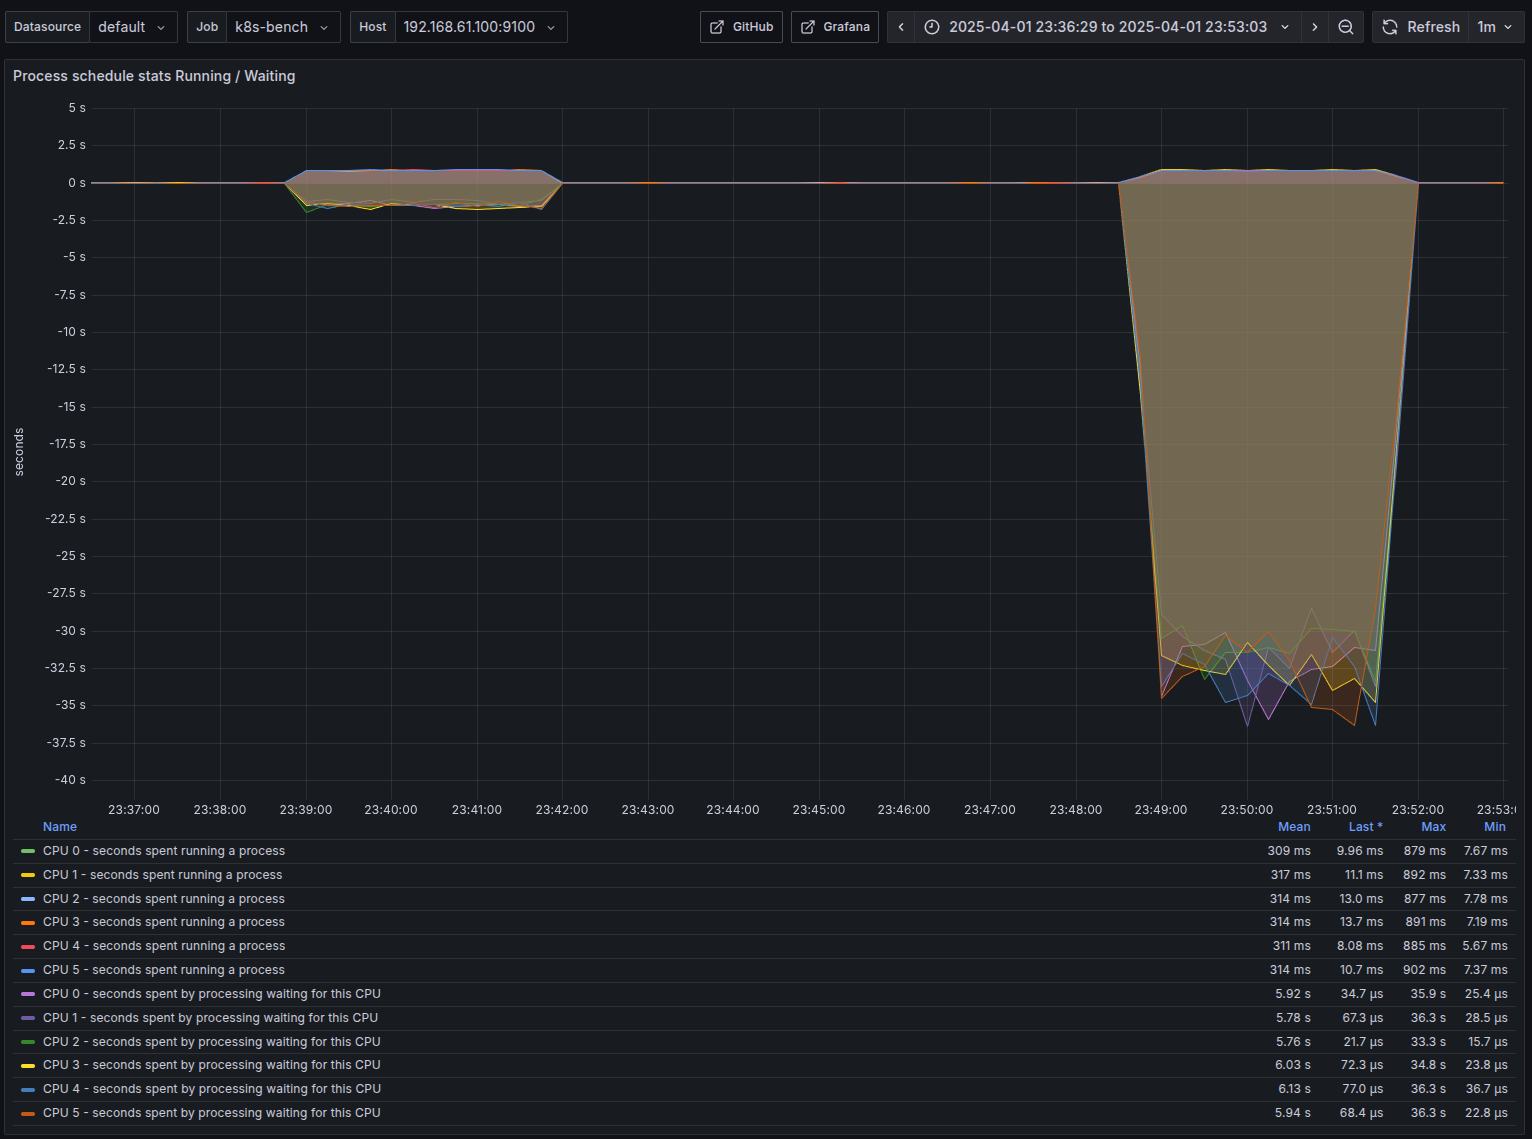
- Things look a lot more interesting here.
- Max time spent waiting for the CPU cores - around 34 seconds when G=32 vs only ~900ms when G=1
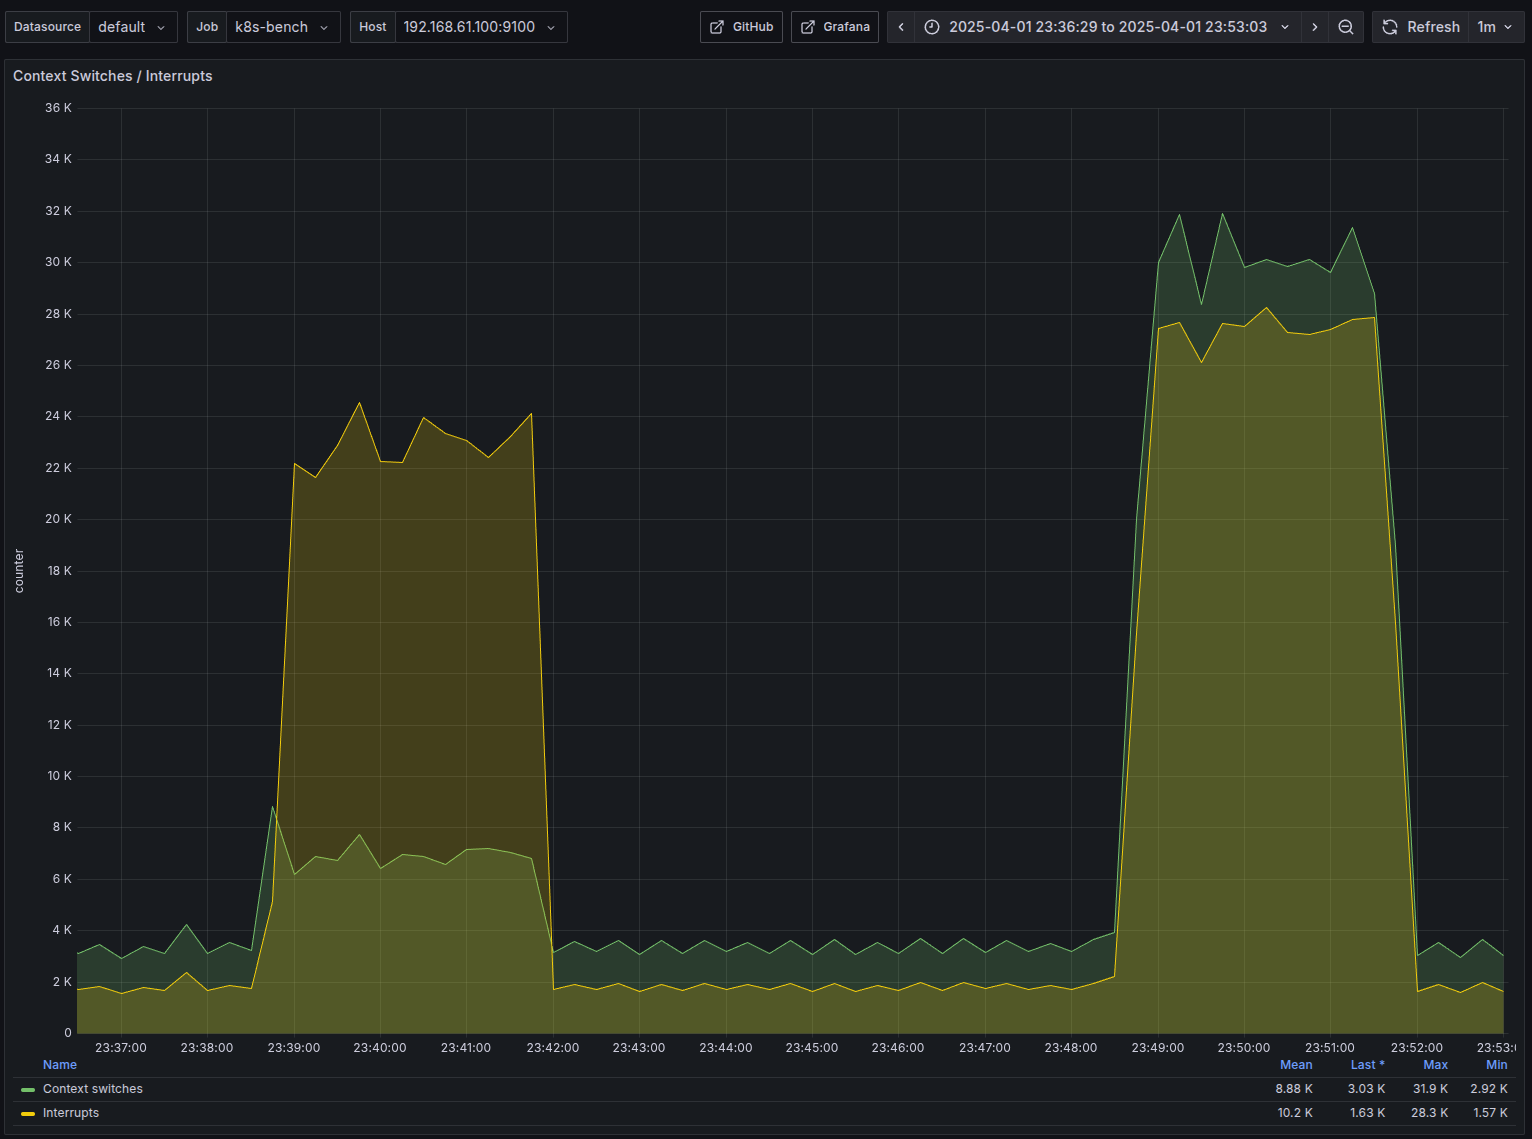
- As we expected, there is a huge increase in the number of context switches with GOMAXPROCS=32 compared to it being 1
- Around 6.5k vs 30k context switches
The Fix
The benchmarks clearly shows wasted performance due to misconfigured GOMAXPROCS.
Luckily, the fix is very simple, just set GOMAXPROCS same as the CPU limit applied to the deployment. In Kubernetes, this can be achieved through setting the environment variable GOMAXPROCS
You can set it like this
env:
  - name: GOMAXPROCS
    valueFrom:
      resourceFieldRef:
        resource: limits.cpu
        divisor: "1"
For example, our test app full deployment yaml would look like this
apiVersion: apps/v1
kind: Deployment
metadata:
  name: k8s-bench
  labels:
    app: k8s-bench
spec:
  replicas: 10
  selector:
    matchLabels:
      app: k8s-bench
  template:
    metadata:
      labels:
        app: k8s-bench
    spec:
      containers:
      - name: k8s-bench
        image: mansoor1/golang-bench:0.2
        env:
        - name: GOMAXPROCS
          valueFrom:
            resourceFieldRef:
              resource: limits.cpu
              divisor: "1"
        ports:
        - containerPort: 7000
        resources:
          requests:
            cpu: "100m" # Let us have more pods than CPU
          limits:
            cpu: "2"
And if we do a describe, we will see that it has automatically set the value GOMAXPROCS to match the CPU limit here, which is 2
> kubectl describe pod k8s-bench-8db849fdf-tdz4x | grep -A2 Environment:
    Environment:
      GOMAXPROCS:  2 (limits.cpu)
    Mounts:
Bonus Fix
A kind redditor pointed me to this cool library by Uber , which I think is a good way to completely avoid this issue
Conclusion
It was a lot of fun doing this experiment and seeing the Grafana dashboard clearly showing how context switching silently eats away performance when GOMAXPROCS is misconfigured. The benchmarks are definitely a worst case scenario, but it costs nothing more than 5 lines to fix. So why not take advantage of it.
So if you’re running Go apps in Kubernetes, take a moment to check your GOMAXPROCS. You might be leaving performance on the table without even knowing it.
Curious to hear your thoughts on this – should I do more of these sorts of tests? Let me know in the comments!
And thanks for reading :)


Member discussion